In this short article I'd like to present my longtime favorite complex plane fractal, the Burning Ship. This will be very non-technical and non-scientific.
A little theory
For a start, a bit of theory. Complex plane fractals are simply sets of complex numbers. Because complex numbers are in fact pairs of real numbers, these fractals can be presented on a plane as nicely-looking images.
For most standard fractals, we say that a complex number is part of the set if, after applying some sort of iteration, it remains bounded. The iteration step is usually given as a simple mathematical formula and to check whether the point is bounded, we perform an arbitrary maximum number of iterations. If the point has not escaped from an arbitrarily chosen disc during iteration, we can assume it's bounded. If it has, we make the assumption that it's unbounded.
The iteration formula for the Burning Ship fractal looks like this:


As you can see, it's very similar to the formula for the Mandelbrot set. The only difference is that the real and imaginary parts of  are always kept positive using absolute values. However, the fractal itself is very different.
Generation
The iteration starts from  , then in each step the real and imaginary part of
  are substituted with their respective absolute values, the number is squared and
  is added. In this example,
  is the actual complex number which is tested. A typical way to compute this and other similar fractals is to iterate the formula at most
  times, where
  is an arbitrary maximum number of iterations. If
  hasn't escaped farther than
  away from
  , it can be considered bounded, thus belonging to the fractal set. Otherwise, we assume
  is unbounded under the iteration and classify it as not belonging to the set.
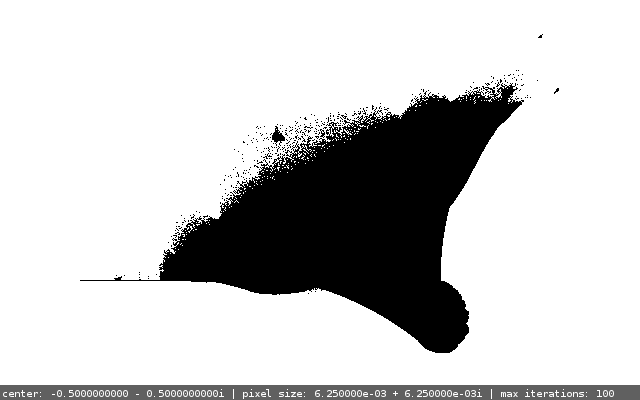
When you iterate like this for points in a complex rectangle between roughly  and
and  , and draw the bounded ones (fractal) in black and the unbounded ones (background) in white, with a certain resolution (assume a certain "complex" size of a pixel) you should get an image which looks more or less like this:
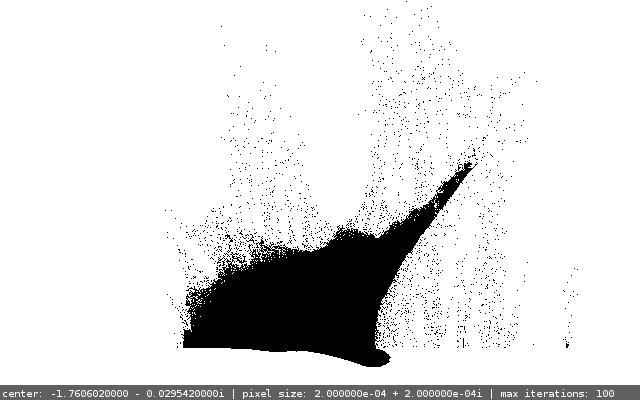
Well, this definitely doesn't look very cool, needless to mention it's much uglier than for example the Mandelbrot set in my opinion. But the worst error to make here is to leave it right here. Take a look at that little blob on the very left of the picture ("standing" on the line). Here is its zoomed version:
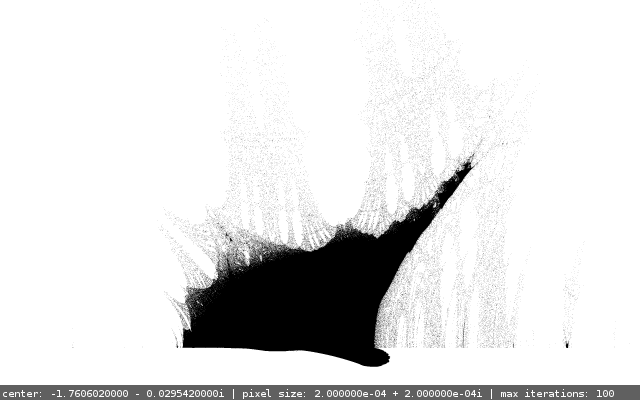
The shape might be interesting, but look what happens after the image is generated in higher resolution and then scaled down (where every pixel in the lower resolution image is the average of respective pixels in the hi-res image):
Better, isn't it? Now let's get a bit deeper into some arbitrary point in the grey mesh:
The possibilities are endless, and I dare claim that this fractal is much more diverse and interesting than the Mandelbrot set, which seems to look the same on various levels of zoom. Though all in all it's obviously a matter of taste and preference.
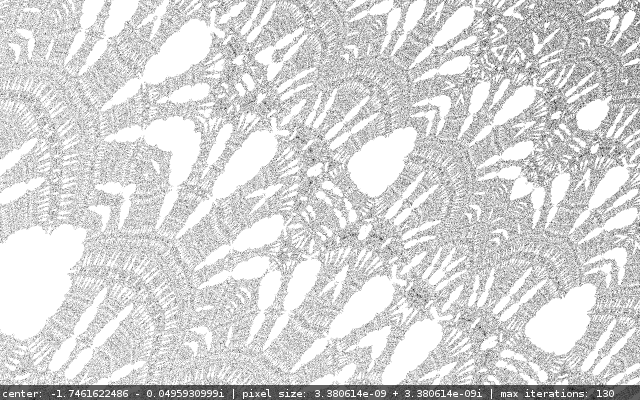
The interesting thing about this image and a lot of similar images is the fact that I have no idea whether the gray points actually belong to the fractal set, because as you increase the maximum number of iterations, the whole image gets more and more white and at about 500 iterations only a couple of dots remain.
Take a look at the same fragment but at 130 iterations:
Because I have no idea about the more advanced math behind these beautiful things, I can only suspect that the most interesting parts are not even the actual fractal, but rather the points which escaped the iteration, but some of them managed to do it before the maximum number of iterations was reached, and some other would do it a bit later.
The phenomenon observed in the previous images leads to the simple conclusion, that the points which aren't part of the fractal are actually much more interesting and prettier. That's why it is worth to color them nicely.
Coloring
So far I've described how to tell if a complex number is in the set or not. Now let's get down to coloring. There are various techniques of coloring non-fractal points, but all of them choose the color depending on how fast the unbounded point escapes, usually by measuring the distance between versions of  from 2 consecutive iterations. One of the easiest good-looking approaches to coloring is using this formula:
 ,
,
where  is the number of iteration where the point "escaped" (
 , where
  is the bailout radius - the radius of the disc escaping from which signifies unboundedness).
The real number  is called the Normalized Iteration Count (source: García, Francisco; Ángel Fernández, Javier Barrallo, Luis Martín. Coloring Dynamical Systems in the Complex Plane). This basically means that coloring this way is a better version of coloring by the number of iteration in which the point escaped, because the result is smoother. Having
  , we only need to multiply it by a constant factor, then take the integral part modulo
  , where
  is the number of colors in the palette and this way we get the index of color in the palette. I have decided to normalize
  in such a way, that all colors from the palette are used. This reduces one parameter (the scaling coefficient) and allows me to change colors (shift the palette) by changing the maximum number of iterations.
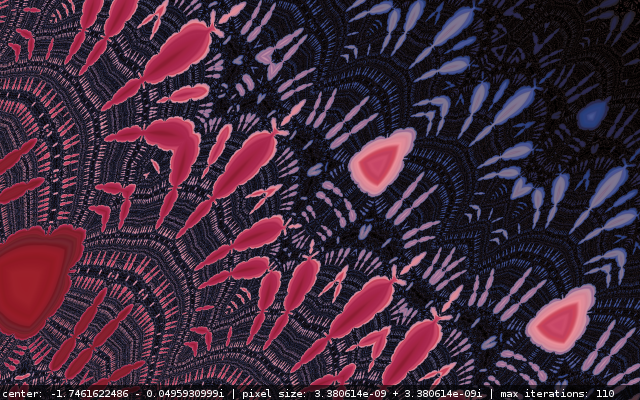
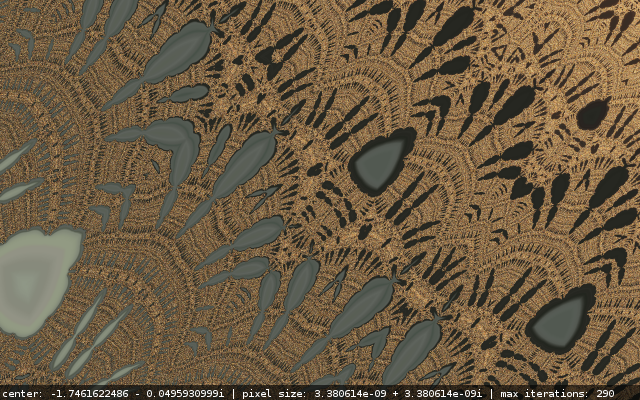
Here are 2 images generated with different numbers of iterations, but the same color palette. As you can see the maximum number of iterations changes not only the precision and level of detail (in fact this changes only at the lower values), but also shifts the color palette, which is rather natural, considering the fact that the color (or actually color number) depends on the speed at which the point escapes. Makes sense if you think about it.
One word on color palettes
So how to prepare a nice color palette, you may ask. It basically needs to meet 2 requirements. It has to be large enough (a thousand colors seems fine) and it has to be smooth. The way I do it is: find a nice gradient image or photo with smooth color transitions using google images, and then cut a 1-pixel high strip of pixels. And that's your palette! You can see the results below.
More eye-candy
Here you can check out a small gallery of little fragments of the Burning Ship set I've generated.
For those of you who want to have some of these on their desktops, here is a package with all those images in hi-resolution without the bottom labels: burning_ship_hi_res.zip.




What particular program did you use to visualize and assign colors to your chosen math there? I'd have loads of fun zooming and assigning colors. Great blog and thanks for sharing! ...And I just realized this was written in 2013 and so I bet this won't even get a reply 🙁
Mikey,
check it out here: https://github.com/komar007/ssefract
Unfortunately, it's an old project I did on studies, may be hard to compile...
Contact me here if you have problems.
I've dropped you an e-mail. Check spam:)